
The VB Watch Debugger is a tool to trace execution and debug compiled applications. It is the kind of tool you might only use once in your life, but this only time will pay 10 times its price back.
If you want to debug your applications after they are compiled, you cannot use the Visual Basic debugger because it will only debug them at design time. The VB Watch Debugger provides all the functionality required to perform such a task. The following are situations when you may need to debug a compiled program:
if you suspect your Visual Basic program is behaving differently at run time than it is at design time
The debugger is also very convenient to monitor complex exe/dll/ocx interactions.
Take control of your application

Using the VB Watch Debugger you may pause a running compiled application, and step through it procedure by procedure or even line by line. You see lines exactly as they are in your code, with their line number in case two lines are identical. You see procedure calls with their arguments. You can set up breakpoints inside your code (equivalent to Stop statements), and you may also define additional breakpoints dynamically, even after the file is compiled.
Not only a debugger, but also a monitor
Additionally, the VB Watch Debugger provides many windows to help you understand how your program is really behaving:
The Source Code window
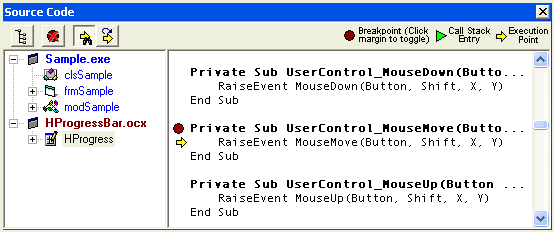
This window displays the original source code. You can follow the execution here, or even set breakpoints at runtime.
The Trace window
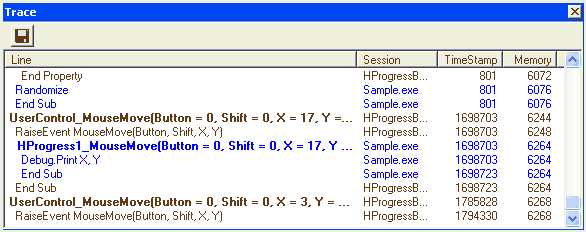
This window shows lines and procedure calls as they are executed. When more than one executable is running (typically an exe with some ocx/dll), the Trace window of the Common tab is very useful for analysing interactions between each.
The Call Stack window
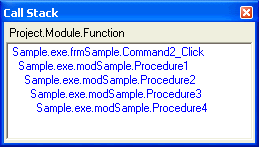
This window displays the call stack in real-time.
The Debug window
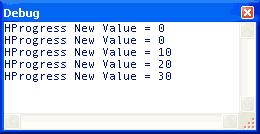
This window captures the Debug.Print statements that are executed in your code and displays the output as if you were in the Immediate window of the VB IDE.
The Instances windows
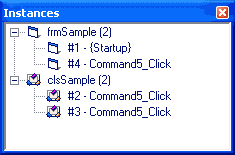
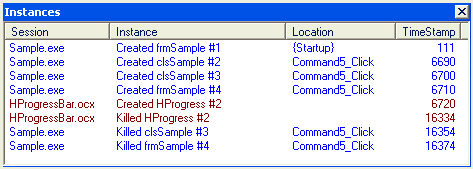
Have you ever tried to debug an object that doesn't terminate as expected or a form that stays in memory even when it's supposed to unload ? The debugger keeps a count of all active forms, classes and user controls, telling when and where they were created or destroyed so that you can easily figure out what's going wrong.
The Variables window
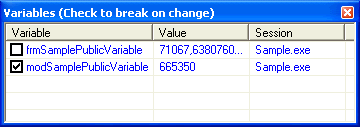
This window displays the value of critical public variables in real time. You may break the application when a value changes.
The Memory window
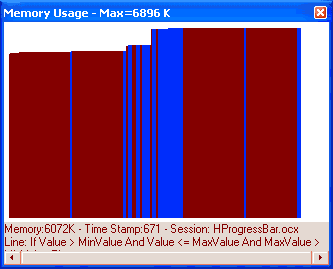
This window displays graphically the total memory your application is using. Use this to find about memory leaks. By just moving the mouse over a part of the graph you can discover where and when in your code it was measured.
Some nice additional features
- remote debugging at client site via TCP-IP
- popup menu to pinpoint a line in the original source in VB:
